
Classify the signal
Understand whether the alert is noise, degradation, or operational risk.
Signal Audit
Signal Audit turns production telemetry into operational intelligence—showing engineering teams what matters, why it matters, and what to do next.
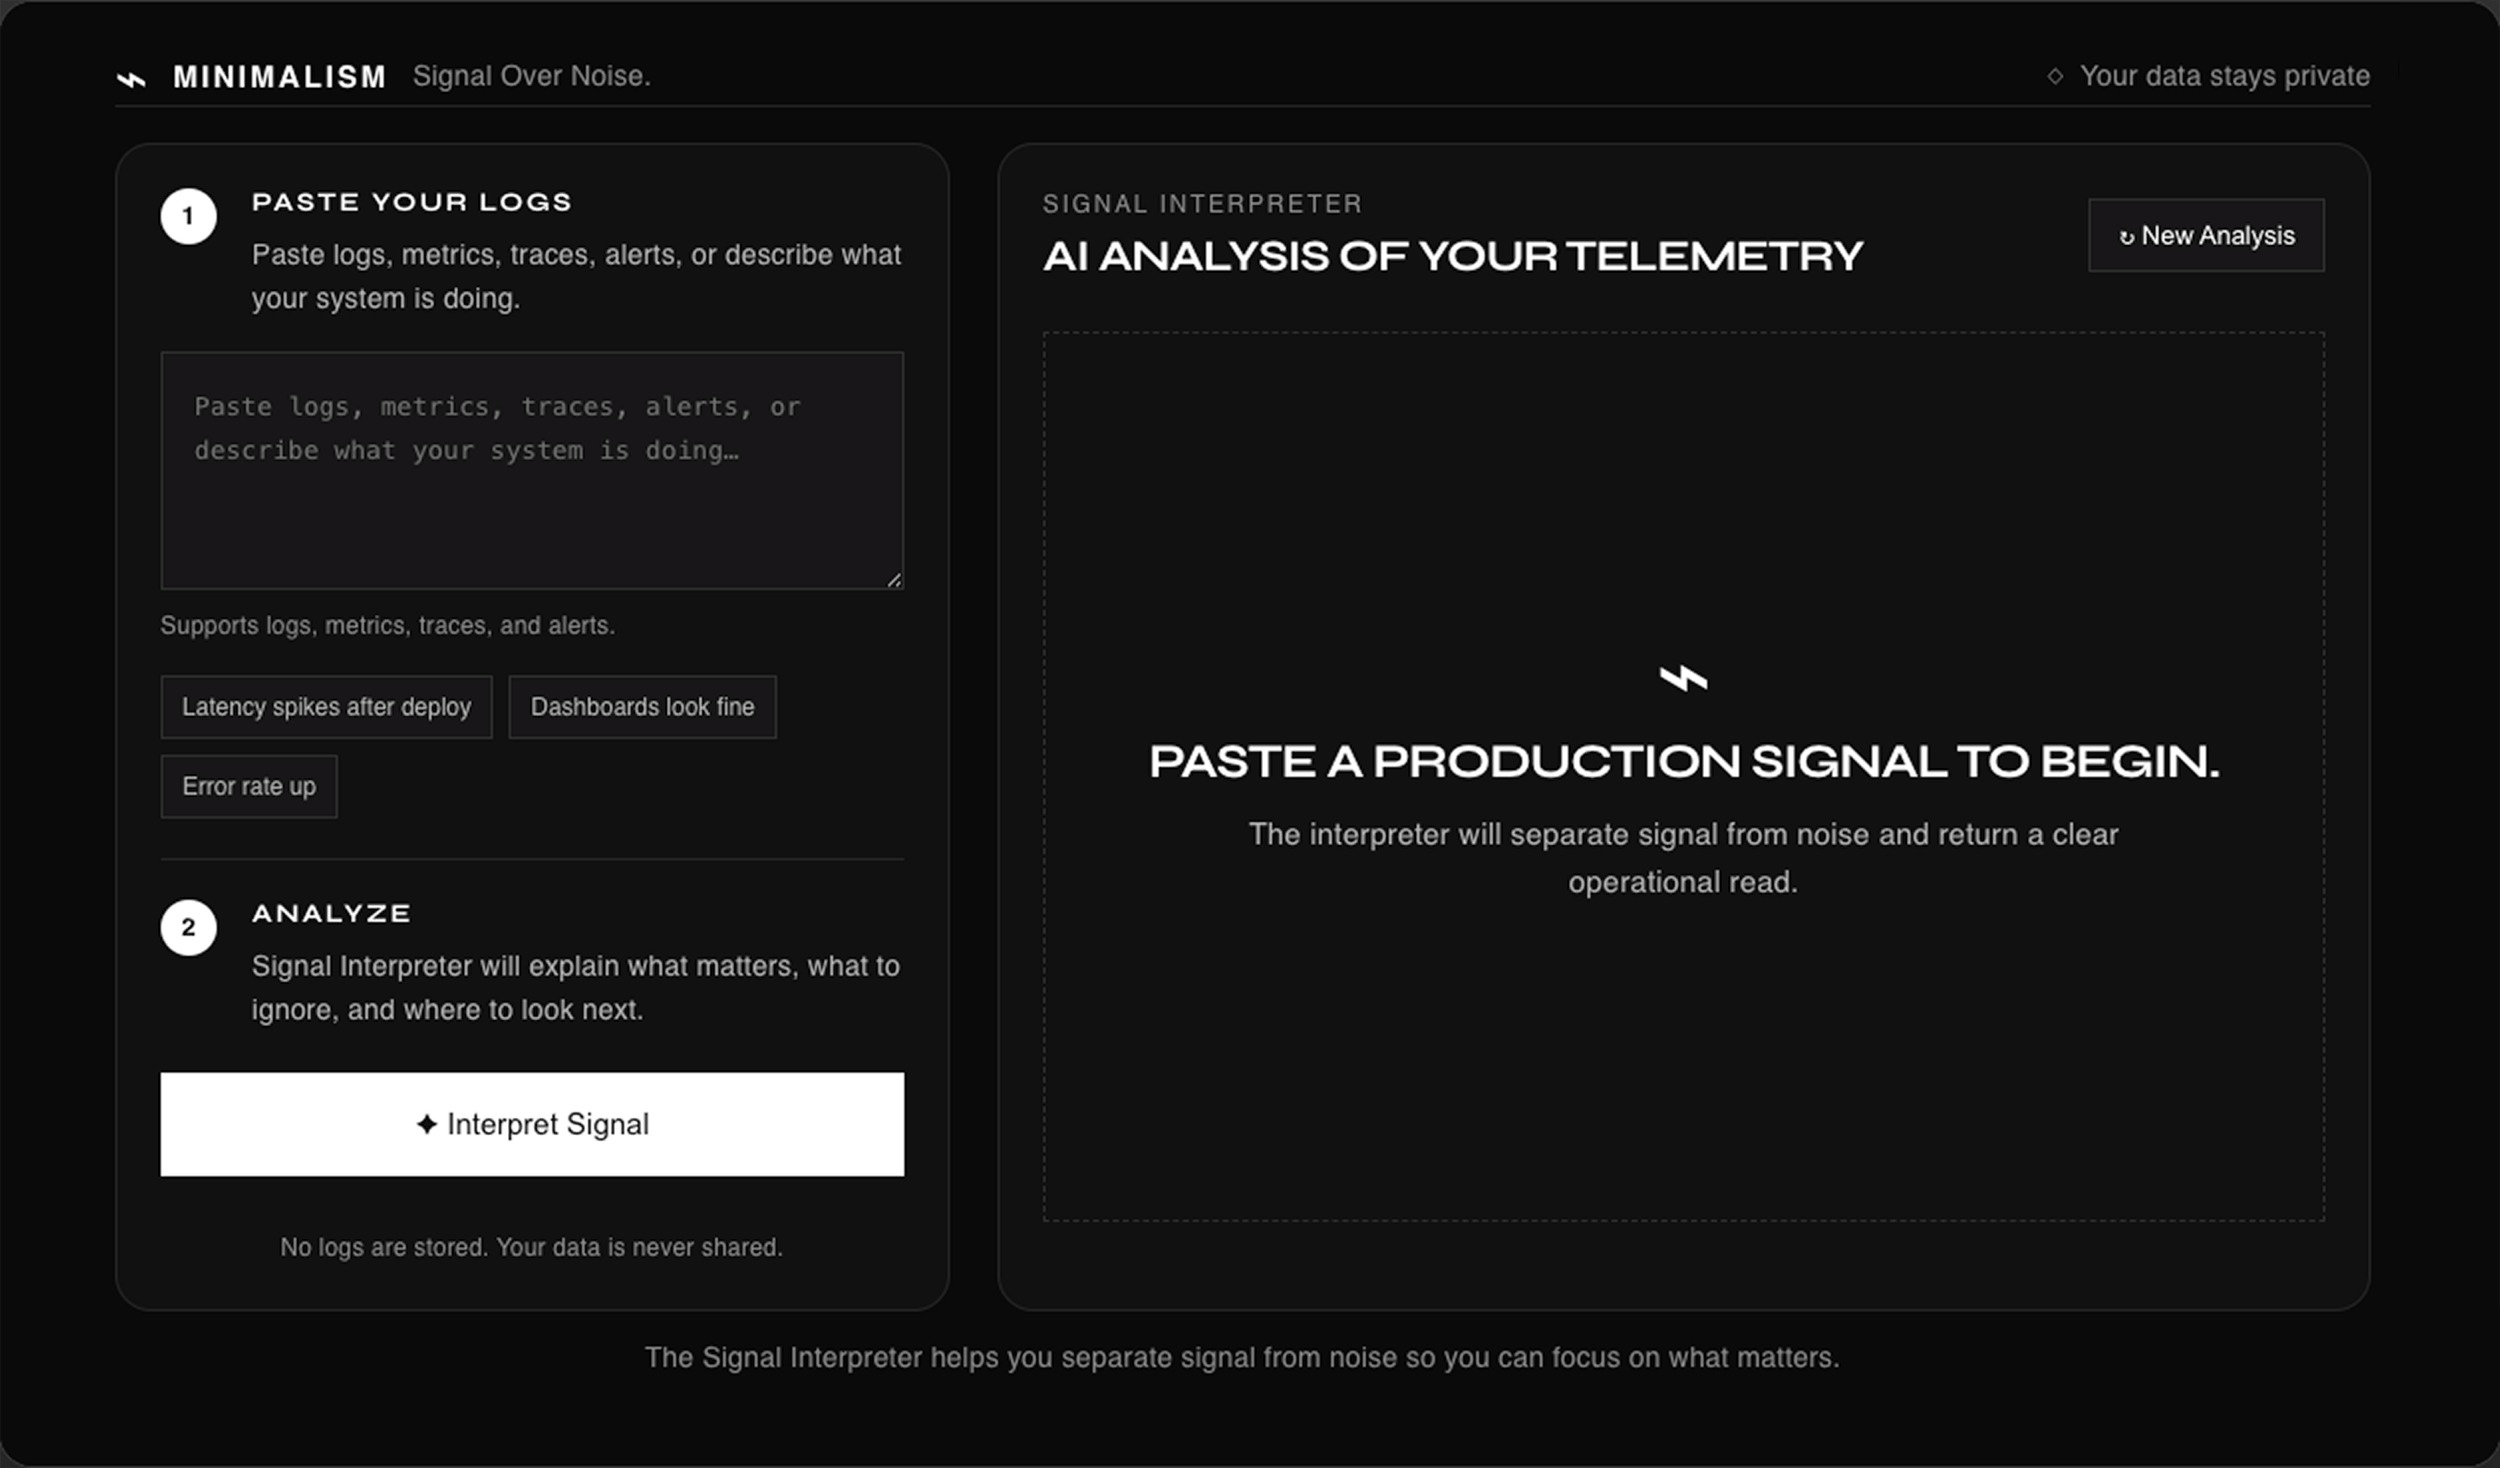
See Signal Audit in action
See Signal Audit turn production telemetry into operational intelligence in 90 seconds.
Signal Interpreter
service=payments-api
  event=HTTP_500_SPIKE
  window=09:14-09:32 PST
  latency_p95=2800ms
  retry_count=17
  recent_change=deployment_2026.07.05-rc3
Understand whether the alert is noise, degradation, or operational risk.
Connect symptoms across telemetry instead of chasing isolated alerts.
Give teams a clear place to look and a practical next step.
Executive Summary
Signal Audit turns production telemetry into operational intelligence—helping engineering teams understand what matters, why it matters, and what to do next.
Start with the platform. Bring us in for a focused operational engagement. Or work with Minimalism continuously to assess, interpret, and improve how your organization responds to production signals.
Operational intelligence software for teams that want to operate Signal Audit themselves.
A focused engagement to integrate Signal Audit, assess your operational environment, establish a baseline, and identify opportunities for improvement.
Signal Audit combined with continuous operational assessment, signal analysis, engineering guidance, and recurring findings.
Observability Gap
Collect everything
Correlating deployment timing, latency movement, retry behavior, dependency health, and historical baselines.
Interpret what matters
Act with confidence
Why this matters now
Signal Audit finds the pattern behind the noise — so you can act before it escalates.
An alert fires — something looks off.
Dashboards show symptoms, not cause.
Signal Audit connects the dots across systems.
The true source of the issue becomes visible.
You get clear answers, not more noise.
Integrations
Signal Audit ingests production telemetry from observability platforms, analyzes what matters with AI, preserves signal history, and delivers operational intelligence directly to your team.
Production alert intelligence
Production telemetry intelligence
Signal Audit
Every incoming signal is normalized, analyzed, connected to its lifecycle, and preserved as operational context.
Intelligence delivered where teams already work
Elevated latency detected in payments-api.
The signal represents persistent degradation rather than a short-lived traffic spike.
Choose your path
One-Time Signal Audit
A focused review of production signals, alert patterns, and operational risk.
Signal Audit + Slack
Signal Audit delivered inside Slack, where engineering teams already respond.
Enterprise Review
A strategic review for larger teams with complex observability and incident response environments.
The Signal Audit Platform
Signal Audit connects to production observability platforms, receives alerts automatically, analyzes what matters with AI, preserves the signal lifecycle, and delivers decision-ready guidance directly into your team's workflow.
Grafana and Datadog send firing and recovery events directly into Signal Audit through authenticated integration endpoints.
Signal Audit evaluates service behavior, deployment timing, dependency pressure, historical context, urgency, and likely operational impact.
Grafana alert recorded
Persistent degradation identified
Slack thread created
Resolution linked to original event
Every signal is recorded from initial detection through analysis, delivery, and recovery so operational context is not lost when an alert clears.
Latency and retries increased after deployment. Review downstream health, retry behavior, and timeout configuration.
Signal Audit posts the original alert as a Slack parent message and adds its AI analysis as a threaded response for focused team collaboration.
One extensible operational-intelligence pipeline
The observability vendor may change. The Signal Audit workflow remains consistent.Security & Architecture
Signal Audit receives telemetry through authenticated integrations, interprets operational signals, and delivers structured intelligence into your existing workflow. Your observability platforms and production systems remain authoritative.
Proof
Case Study 001
Published Analysis
Engineering Investment
It’s your engineering team.
A software company with 50 engineers can invest more than $10 million annually in engineering operations. Signal Audit deploys for $5,000.
Signal Audit doesn’t replace Grafana, Datadog, or your existing observability platform. It helps your engineering team make better operational decisions from the telemetry those platforms already produce.
The question isn’t whether Signal Audit is expensive. It’s whether improving operational decision-making is worth a fraction of the engineering investment you’ve already made.
Engineering Investment Calculator
Use your organization’s numbers to estimate engineering operating expense, incident-response cost, and the relative cost of deploying Signal Audit.
Product Walkthrough 001
See how Signal Audit receives a production alert, interprets what matters, records the signal lifecycle, and delivers decision-ready guidance directly into Slack.
Have questions before scheduling?
Every production environment is different.
If you're unsure whether Signal Audit is the right fit, I'd be happy to discuss your current observability challenges and help determine whether Signal Audit would provide value for your team.
No sales pressure. No obligation.